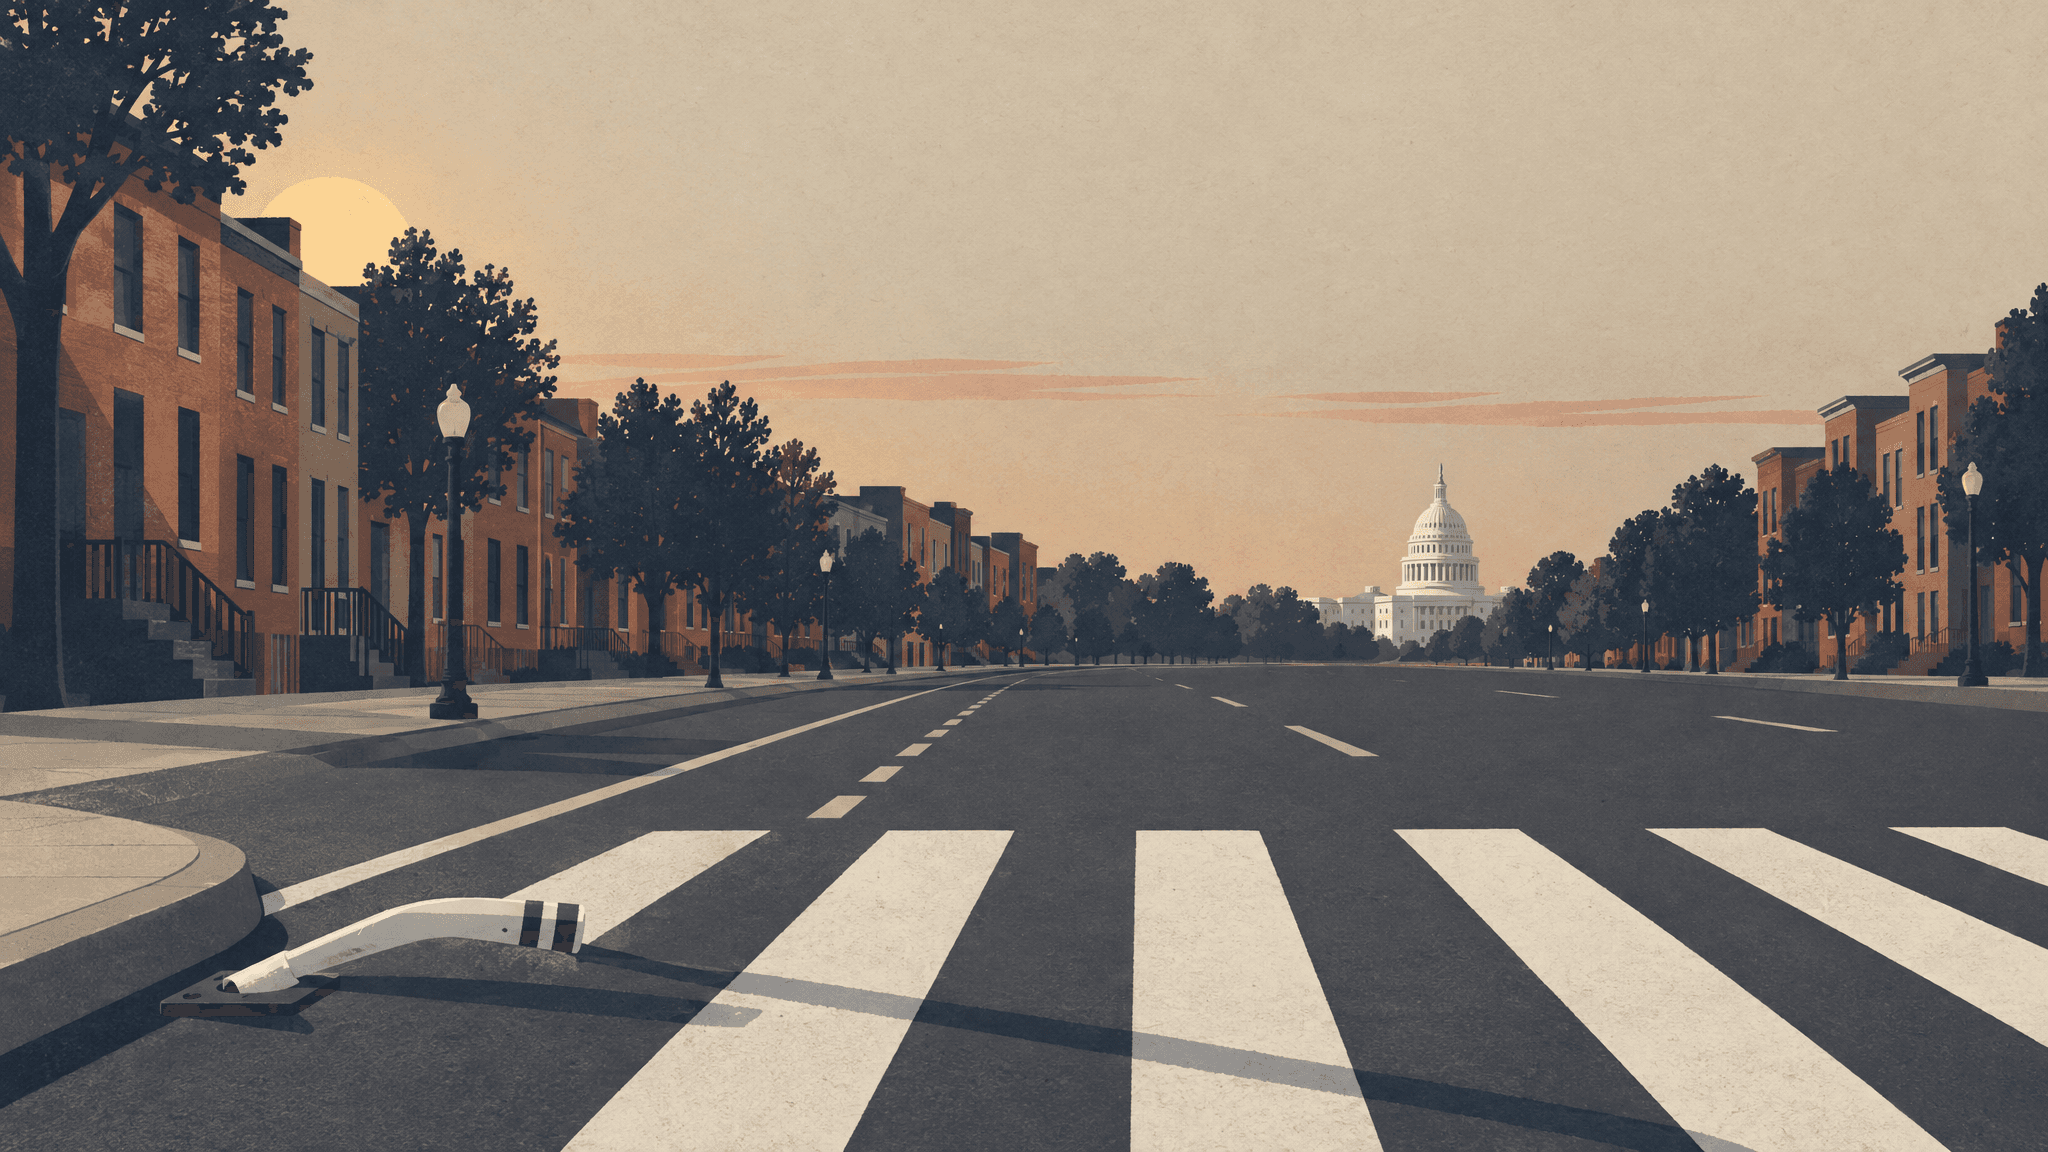
Serious pedestrian and cyclist crashes in D.C. hold at 127 after last year's jump
The count through early October is down 0.8% from last year's pace but up 30.9% from the year before, when there were 97.
Serious crashes involving people walking and biking in the District have stopped climbing in 2026, but they have not come back down. From Jan. 1 through Oct. 9, crash records show 127 crashes in which a pedestrian or cyclist was killed or suffered a major injury.
That compares with 128 in the same stretch of 2025, a drop of 0.8%. That change is small enough that the year is best described as flat.
The longer view is less reassuring. In the same window of 2024, the District logged 97 such crashes. This year's count rose 30.9% from that level.
The comparison covers the same calendar window in each year, so it is a fair side-by-side look. It also arrives just as the evening commute moves into darkness for the season.
Fewer deaths than 2024, more serious injuries
Deaths tell a somewhat different story than the overall crash count. This year, 15 pedestrians and cyclists were killed in the January-to-October window. That is up from 12 in 2025 but below 17 in 2024.
The rise since 2024 shows up among both walkers and riders. Pedestrians killed or seriously hurt rose from 73 in 2024 to 83 this year.
Cyclists saw the sharper climb. Bicyclists killed or seriously hurt rose from 25 in 2024 to 44 in 2026.
Those trends sit uneasily with the District's broader record. WJLA reported that total traffic fatalities in the District fell sharply from the year before (wjla.com).
Officials say traffic-calming measures, redesigned intersections and automated enforcement are making a difference (wjla.com). Yet serious crashes involving people on foot and on bikes rose in 2025 from 2024 levels and have held there in 2026. The crash records themselves cannot say why.
A District transportation goal stated that by 2024, Washington would reach zero fatalities and serious injuries to travelers on its transportation system (ddot). The counts in this report show that deadline passed with people still being killed and badly hurt while walking and biking.
Where the serious crashes happen
The danger is not spread evenly across the District. We combined the January-to-October windows of 2024, 2025 and 2026 and sorted every crash that could be tied to a ward.
The ward with the most serious pedestrian and bicyclist crashes logged 71 over that period. That was 20.2% of all ward-assigned serious crashes. The ward with the fewest logged 13.
Across all wards, the average was 14.7 crashes per ward per year. The busiest ward ran far above that pace, and the quietest ran well below it.
East of the river, Ward 7 ranked 3rd and Ward 8 ranked 5th by serious pedestrian and bicyclist crashes. Neither carried the most, which may surprise readers used to hearing those wards described as the District's most dangerous.
Outside reviews use different measures and reach different conclusions. A law firm's analysis of DDOT data covering 2014 through mid-2026 attributes a large share of the District's traffic deaths to a small number of wards (Gelb & Gelb, P.C.).
The same firm says Ward 7 and Ward 8, along with another ward, record the most serious injuries relative to their traffic (Gelb & Gelb, P.C.). Those findings have not been checked against the records used here. They also count all traffic deaths or adjust for traffic volume, while our ward ranking counts raw crashes involving walkers and cyclists.
Raw counts do not account for how many people walk, bike or drive in each ward. A ward with heavy foot and bike traffic can rank high on totals, while a less crowded ward may carry more risk for each trip taken.
The crashes behind these numbers can be violent. In a crash reported by WJLA, police said several vehicles collided, a pedestrian was killed, others were seriously injured and a bike was also involved (wjla.com).
Some critics point to unpaid tickets. A person quoted by WJLA said, "We are seeing a lot of people who have a lot of outstanding tickets" (wjla.com). The crash records do not track drivers' ticket histories, so this report cannot test that claim.
What to watch
Automated enforcement is under pressure. The federal government is pushing to eliminate all red-light and speed cameras in the District (wjla.com). Officials have counted automated enforcement among the tools they say are making a difference (wjla.com).
The District's Major Crash Review Task Force analyzes every crash handled by the Metropolitan Police Department's Major Crash Unit (ddot). Its reviews are the place to look for explanations that raw counts cannot give, such as street design or driver behavior at specific locations.
The final months of 2026 will decide how this year ends. With serious crashes running nearly even with 2025 and well above 2024, readers should watch whether the darker evening commute pushes the count past last year's total.
Residents can also watch their own ward. The ward rankings above show where serious crashes cluster, and they offer a baseline for judging whether new street changes or enforcement shifts are working where they are needed most.
How we did this
We used District crash records from DDOT and the Metropolitan Police Department and counted crashes in which at least one pedestrian or bicyclist was killed or suffered a major injury, by report date. We compared the same Jan. 1 to Oct. 9 window in 2024, 2025 and 2026, and ranked wards by their combined totals across those windows, with an average of 14.7 crashes per ward per year as the benchmark.
Serious crash: a crash in which at least one pedestrian or bicyclist was killed or suffered a major injury. Major injury: an injury recorded as major in the crash data, a more severe category than a minor injury. Ward-assigned crash: a crash whose location could be matched to one of the District's wards.
Limitations
- Crash records for 2026 are preliminary and may change as reports are updated or late reports are added.
- Counts are by the date a crash was reported, which can differ slightly from the date it happened.
- Some crashes could not be assigned to a ward and are left out of the ward rankings.
- Ward totals are raw counts. They do not adjust for population, how many people walk or bike, or how much traffic each ward carries.
- Our data included the pedestrian and bicyclist breakdown for 2024 and 2026 only, not for 2025.
- The crash records show what changed, not why. They cannot tell us the effect of street redesigns, cameras or any single policy.
- The law firm analyses cited here use different time periods and measures and have not been checked against our data.
Sources
- The publisher's ArcGIS open-data service (named with each dataset): Vehicular Crash Data, latest period 2026-10-09; retrieved Oct. 12, 2026. Data
Comments (0)
Loading comments…